- Real-time Alerts: Monitor trends and receive immediate notifications about changes.
- Data Consolidation: Bring together disparate data sources for comprehensive insights.
- Improved Decision-Making: Make informed decisions based on accurate, visual data.
- User-Friendly Interface: Navigate complex data effortlessly with intuitive designs.
- Enhanced Collaboration: Share insights easily across teams, fostering better communication.
Get a free quote
 Exploring Career Paths in Web Development and Opportunities with FYKEL
Discover how FYKEL leads the way in web and mobile app development, design, and SEO. Explore digital career paths and innovative IT services for startups and enterprises in the USA.
 Creating an Engaging Experience with Parallax Scrolling
Transform Your Website with Parallax Scrolling
In today’s fast-paced digital landscape, businesses must capture and retain user attention within
 Choosing the Right JavaScript Framework for Your Project: Expert Guidance from FYKEL
Discover how the right JavaScript framework, expertly deployed by FYKEL, can transform your web and mobile experiences. Learn from our proven approach to development, design, and SEO.
 The Future of WebAssembly in Enhancing Web Performance with FYKEL
Discover how FYKEL leverages WebAssembly to drive superior web performance. Learn about our innovative development, design, and SEO services tailored for businesses in the USA.

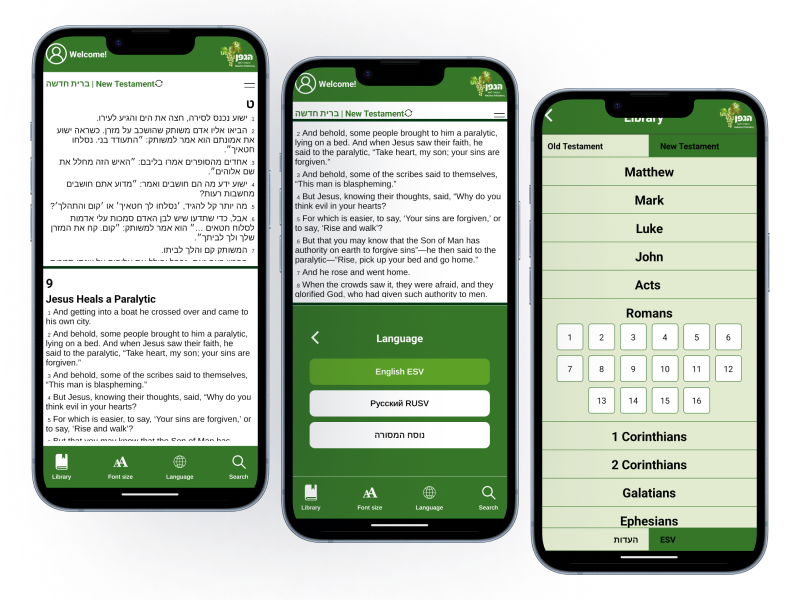
HaEdut - a special mobile application for reading the Bible The HaEdut Bible app, built with Expo React Native, offers a seamless way to read the Scriptures in Modern Hebrew, Masoretic, English, and Russian. Perfect for students and newcomers, it features an intuitive interface and smooth performance for a modern Bible experience.

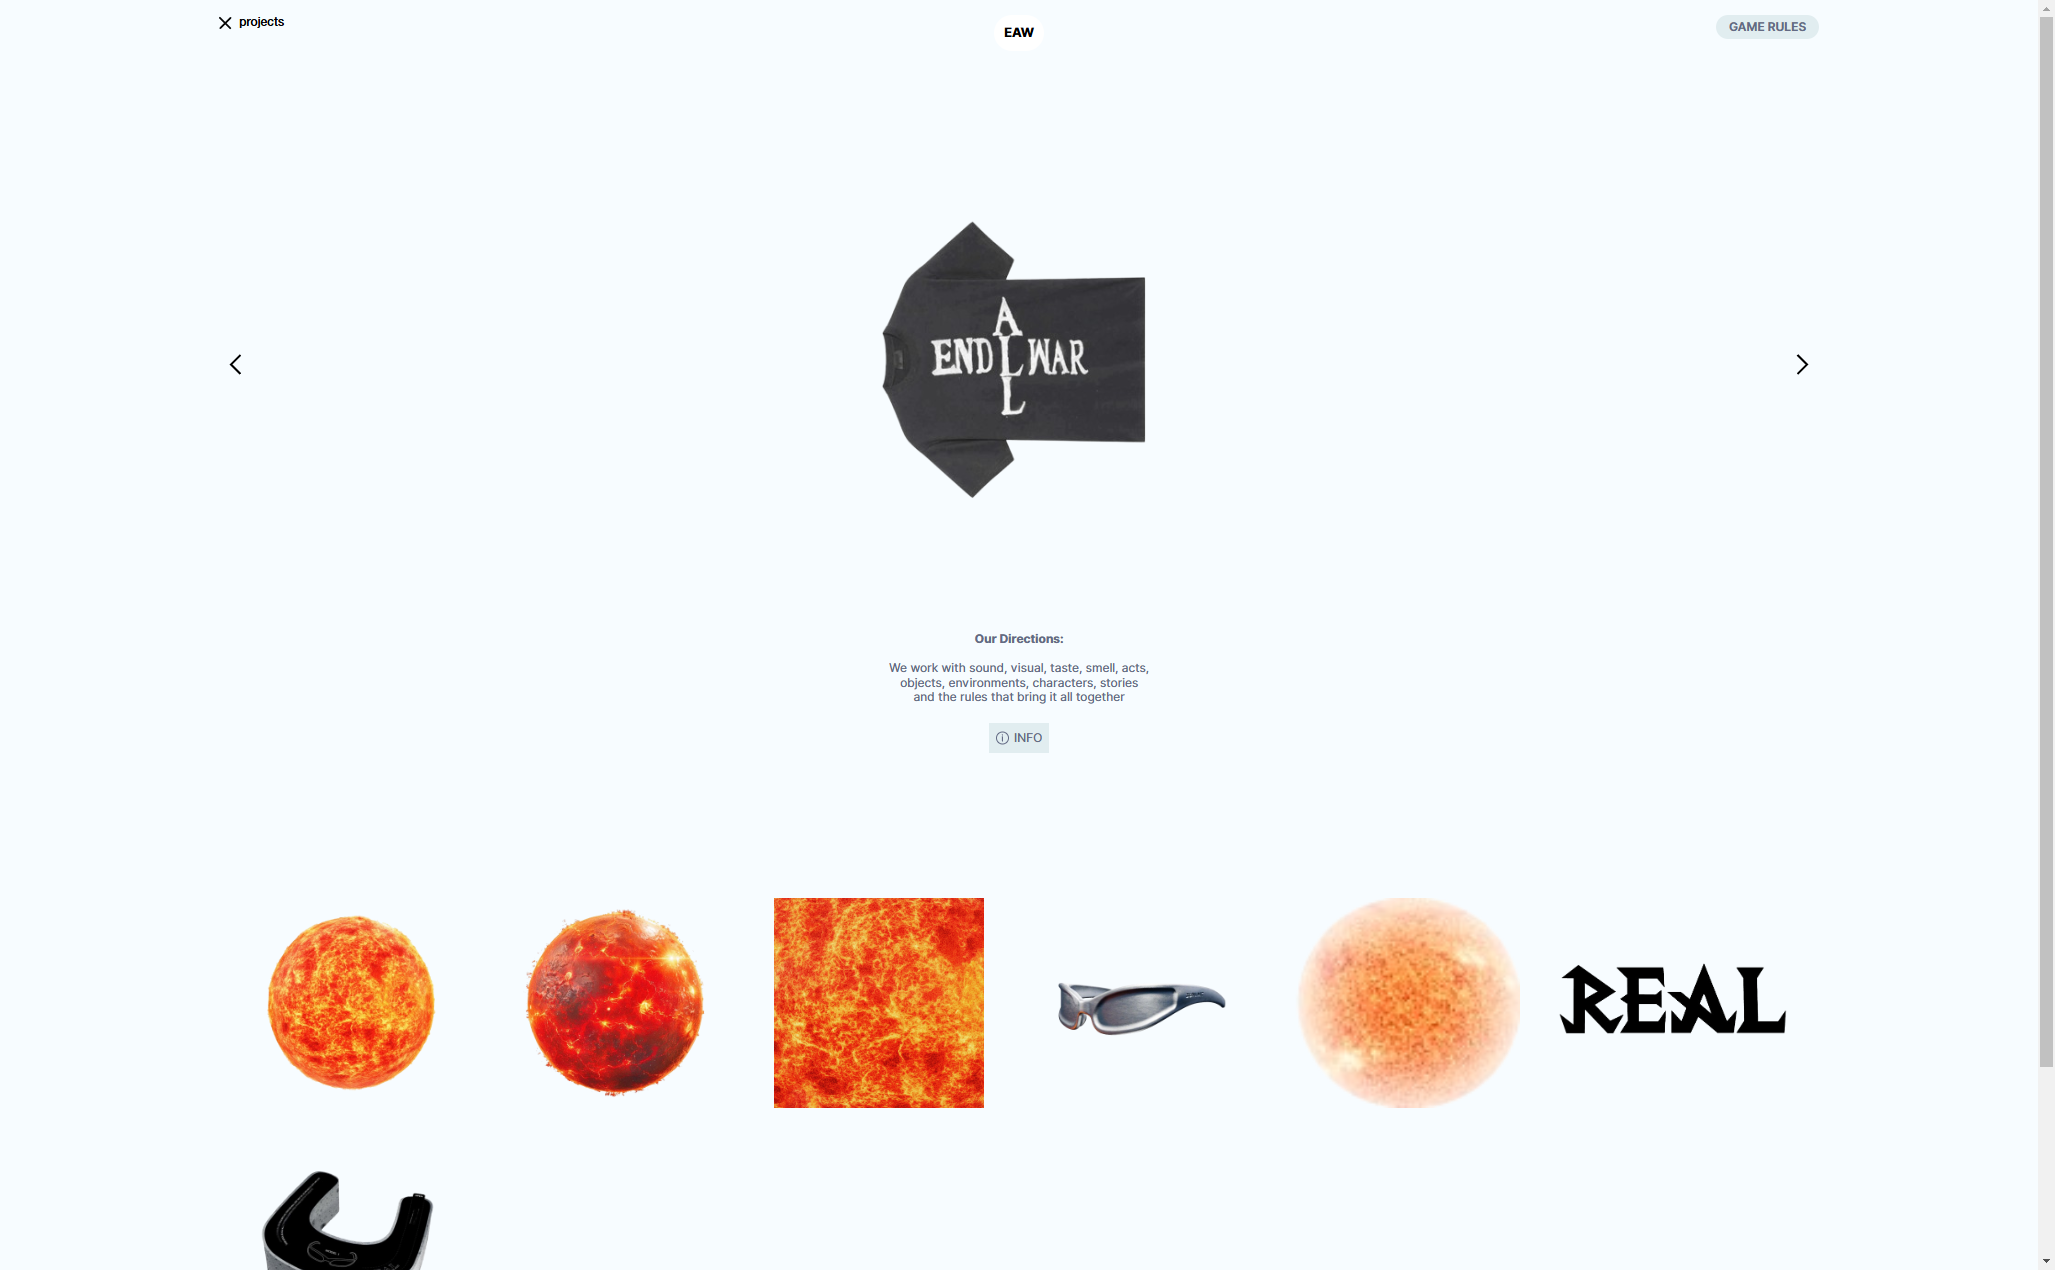
Aliend and Morph - wordpress game website It acts as a digital portal into the client's immersive branding philosophy, inspiring potential clients to think beyond conventional branding strategies.

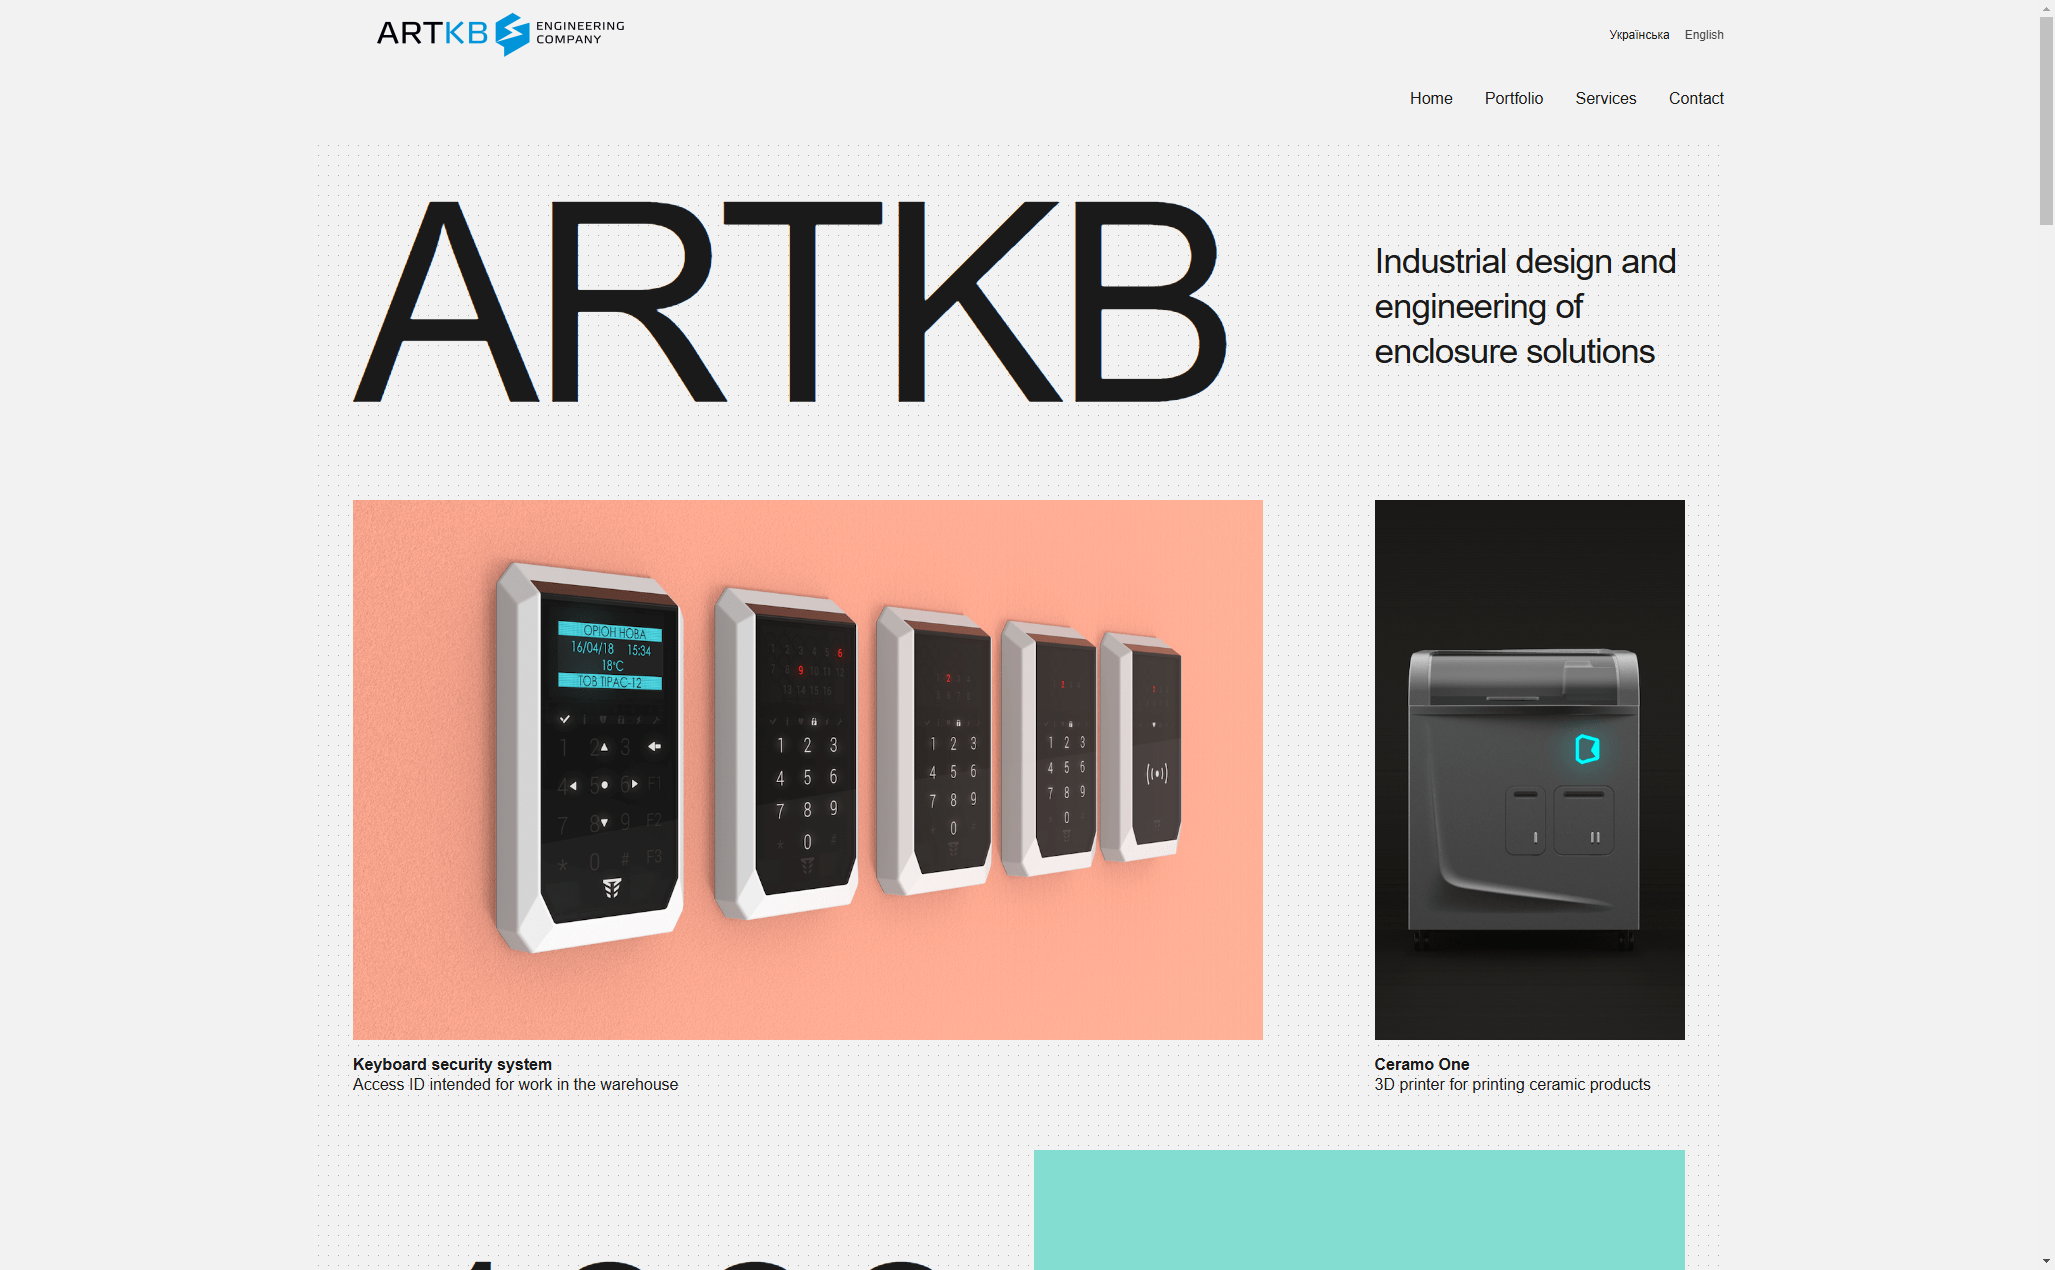
ARTKB - company wordpress website Custom Wordpress Platform for ARTKB to Showcase Their Hardware Engineering Excellence

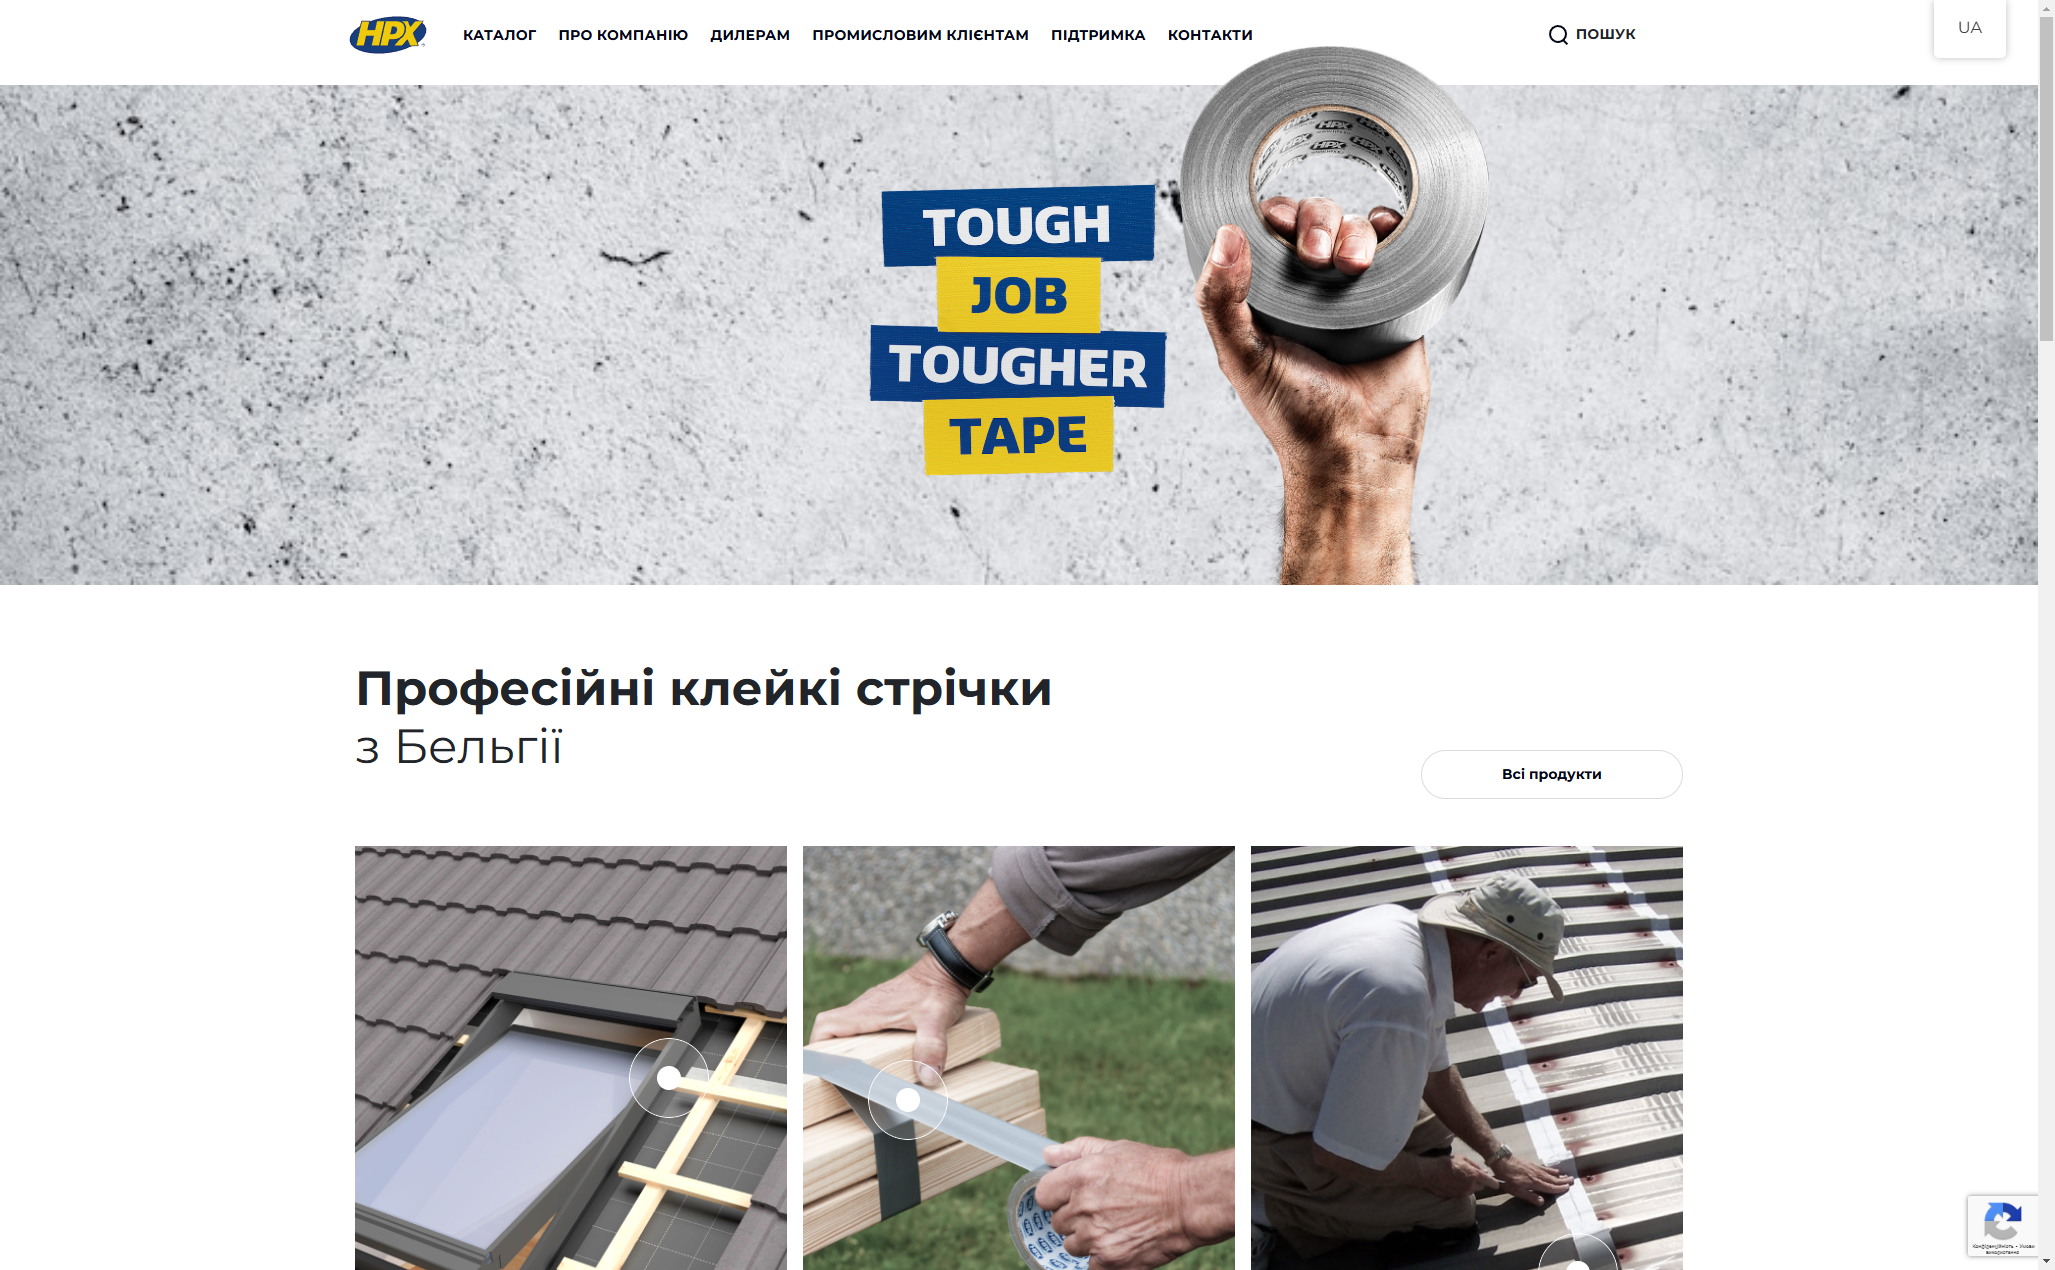
HPX - unique product store | wordpress E-commerce platform for HPX.ua using WordPress and WooCommerce

