 SEO Best Practices for Next.js Applications
Having trouble getting people to notice your Next.js app? The secret to increasing traffic and expanding your company is SEO. Discover professional advice on how to use Next.js's robust features to optimize sitemaps, meta tags, and more. Fykel's cost-effective solutions can help you rank higher and turn visitors into leads for both new and established businesses. Are you prepared to increase your online visibility? Explore our guide right now!
 Building a Blog with Next.js and Markdown
Do you want to increase the online visibility of your company? Using Next.js and Markdown to build a blog is an affordable way to increase traffic and lead generation. From project setup to deployment, this tutorial walks you through the process of building an SEO-friendly blog. You can start a blog that increases your brand recognition and income with Fykel's Next.js development skills. Let's begin!
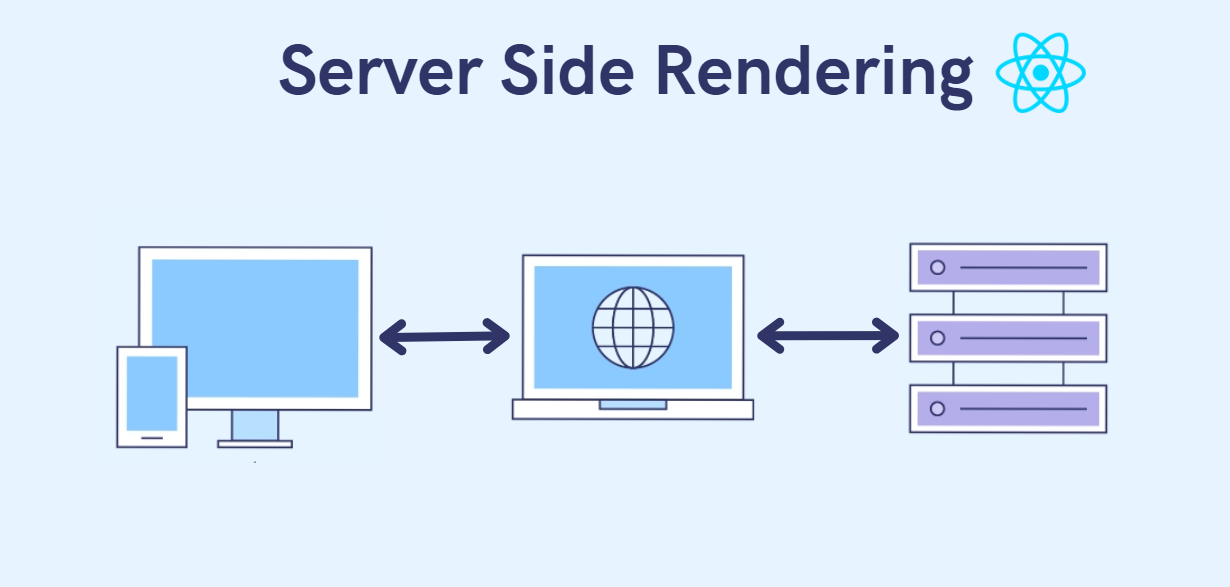 Server-Side Rendering with Next.js: A Complete Guide
Having trouble with sluggish React apps or poor SEO? Next.js's server-side rendering (SSR) creates quick, search engine-friendly pages that increase leads. Fykel's guide explains how to implement SSR and offers advice on how to boost productivity and expand your company by 2025.
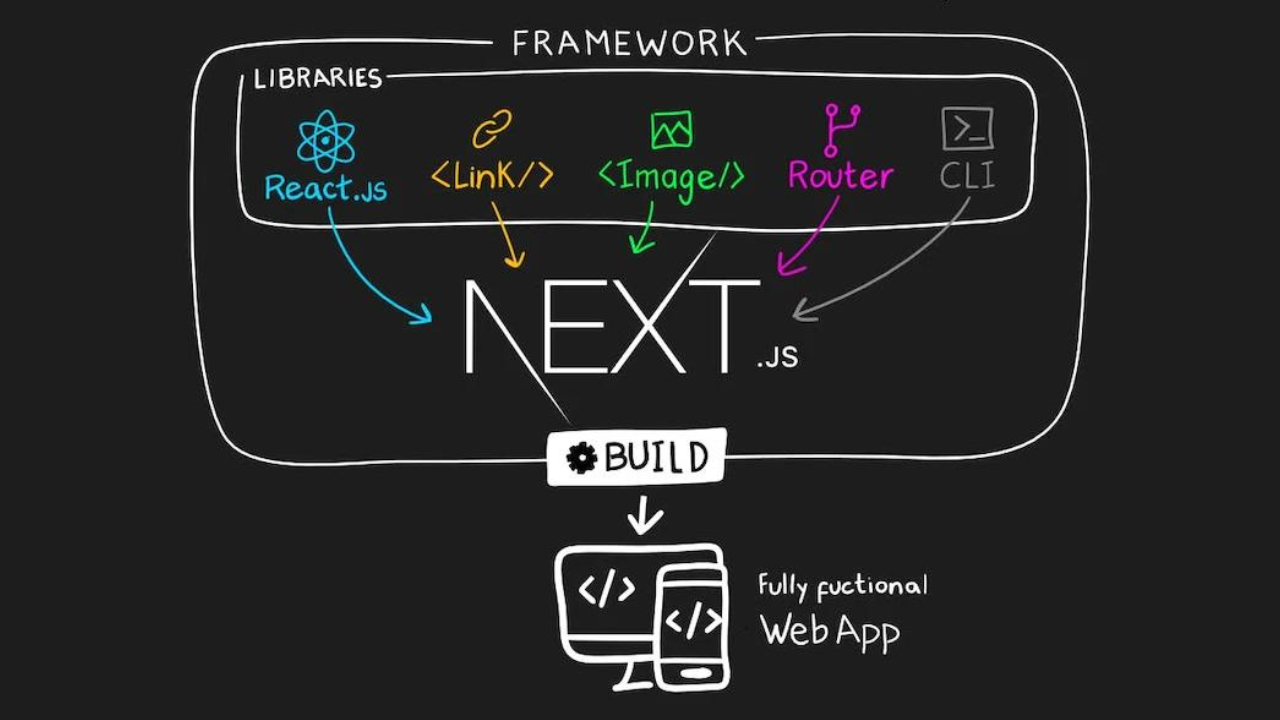 Why Use Next.js for Your React Applications
Having trouble with sluggish React apps or subpar SEO? Server-side rendering, static site creation, and other features are provided by Next.js to help developers create quick, SEO-optimized apps that generate leads. Fykel explains why Next.js is essential for companies in 2025 and offers helpful advice on how to get started and increase sales.
 Optimizing React Applications for Performance
Your business suffers from slow React apps. Learn advanced strategies to improve the performance of React apps, such as memoization and lazy loading. Fykel offers doable tactics to increase speed, user engagement, and revenue in 2025.
 State Management in React: Redux vs Context API
Are you having trouble deciding between the Context API and Redux for your React application? This 2025 guide helps business owners create effective, lead-generating apps by comparing their use cases, scalability, and performance. Find out how Fykel's reasonably priced React development services can help you develop scalable solutions that meet your company's objectives.
 Building a Real-Time Chat App with React and Socket.io
Do you want to develop a real-time chat application for your company? With code and advice, this 2025 tutorial walks you through creating one using React and Socket.io. Discover how Fykel's innovative, reasonably priced solutions can increase lead generation and customer engagement. Ideal for new businesses looking to improve their online visibility.
 React vs Angular: Which One to Choose in 2025
Choosing between Angular and React for your 2025 web project? This guide assists business owners in selecting the best framework by comparing ease of use, scalability, and performance. Discover how the flexibility of React or the structure of Angular can improve your online visibility and generate income with Fykel's innovative, reasonably priced solutions.
 Getting Started with React: A Beginner’s Guide
Are you prepared to create a cutting-edge, interactive website for your company? Using straightforward examples, our 2025 beginner's guide to React explains components, state, and props. Discover how to develop high-performing, reasonably priced web applications that generate leads and increase sales. Take your online presence to the next level by beginning your React journey with Fykel's professional advice!
 WordPress Security: Protecting Your Site from Hackers
Are you concerned that hackers may target your WordPress website? With the help of our 2025 guide, business owners can learn how to secure their websites using low-cost solutions like 2FA, strong passwords, and the best security plugins. Defend your reputation, sales, and leads from online attacks. Create a secure, effective website that promotes growth by heeding our professional advice. Let Fykel keep you safe!
 How to Speed Up Your WordPress Website
Are slow load times on your WordPress website costing you customers? With useful advice like image optimization, caching, and CDNs, our 2025 guide teaches business owners how to make their websites faster. Better SEO, more leads, and increased revenue are all correlated with a faster website. Create a high-performing website that stimulates growth by using our reasonably priced WordPress optimization strategies. Allow Fykel to assist you in your endeavors!
 Top 10 WordPress Plugins for Business Websites
Are you having trouble making your company website stand out? Business owners can increase leads, sales, and performance with the help of our list of the top 10 WordPress plugins for 2025, which includes Yoast SEO and WooCommerce. Discover how to install, configure, and make the most of these reasonably priced tools to build a distinctive, growth-promoting website. Use Fykel's professional advice to elevate your website to new heights!